

What makes our Google Analytics Dashboard different?
Clarity by default
Uplyt shows only what matters — your key GA4 metrics in one clean, visual dashboard. No setup, no noise, just actionable KPIs like traffic, conversions, engagement rate, and top pages.
Context that helps you decide
Compare performance over time (week-over-week, MoM, YoY), break down results by source, device, or country, and spot high-impact trends instantly.
Built for action
From every insight, you can create tasks, assign them to your team, and track their impact. It’s not just a dashboard — it’s a performance engine for marketers and founders.
Features
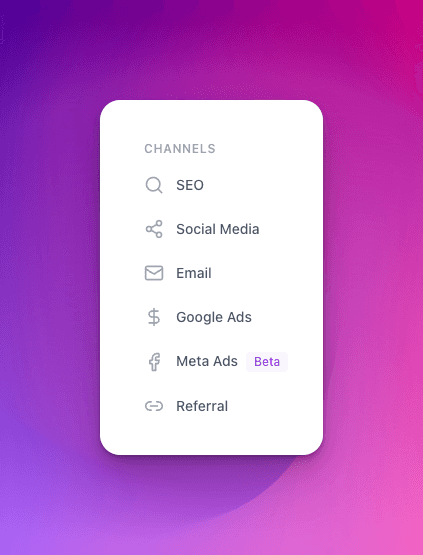
All your traffic sources, all in one place
Stop jumping between GA4 reports to understand where your users come from.
Uplyt gives you a clean view of all your acquisition sources:
Organic search
Google ads
Meta Ads
Email Traffic Campaigns
Direct and referral traffic
You can break down performance by channel, campaign, or page — and quickly identify what drives real value.

Features
Compare M-1 or YoY in one click
Understanding your data means nothing without context.
With Uplyt, you can compare any key metric — traffic, conversions, engagement — across:
The previous month (M-1)
The same period last year (Y-1)
No need to build custom GA4 reports.
You see growth trends and drops instantly, with color-coded insights and smart alerts when something changes.
Features
Let our AI surface what matters
Uplyt doesn’t just show you the data — it tells you what it means.
Our AI continuously monitors your GA4 metrics and surfaces:
Unusual traffic drops (ex: “SEO traffic down 35% this week”)
Conversion trends on key pages
Discrepancies between devices or channels
High-performing segments you can double down on
You don’t need to set up custom alerts or dig into GA4’s Explore section — we highlight what deserves your attention.
