
Individual candles tell you what happened in one period. Candlestick patterns — specific shapes or short sequences of candles — are a step up from that: they describe a recurring situation traders have come to recognize, though none of them guarantee what happens next. This guide assumes the candle-anatomy basics covered in how to read crypto charts and goes deeper into the patterns worth actually knowing, and just as importantly, why the surrounding context matters more than any single shape.
{{IMAGE:assets/images/candle-featured.webp}}
Single-candle patterns worth knowing
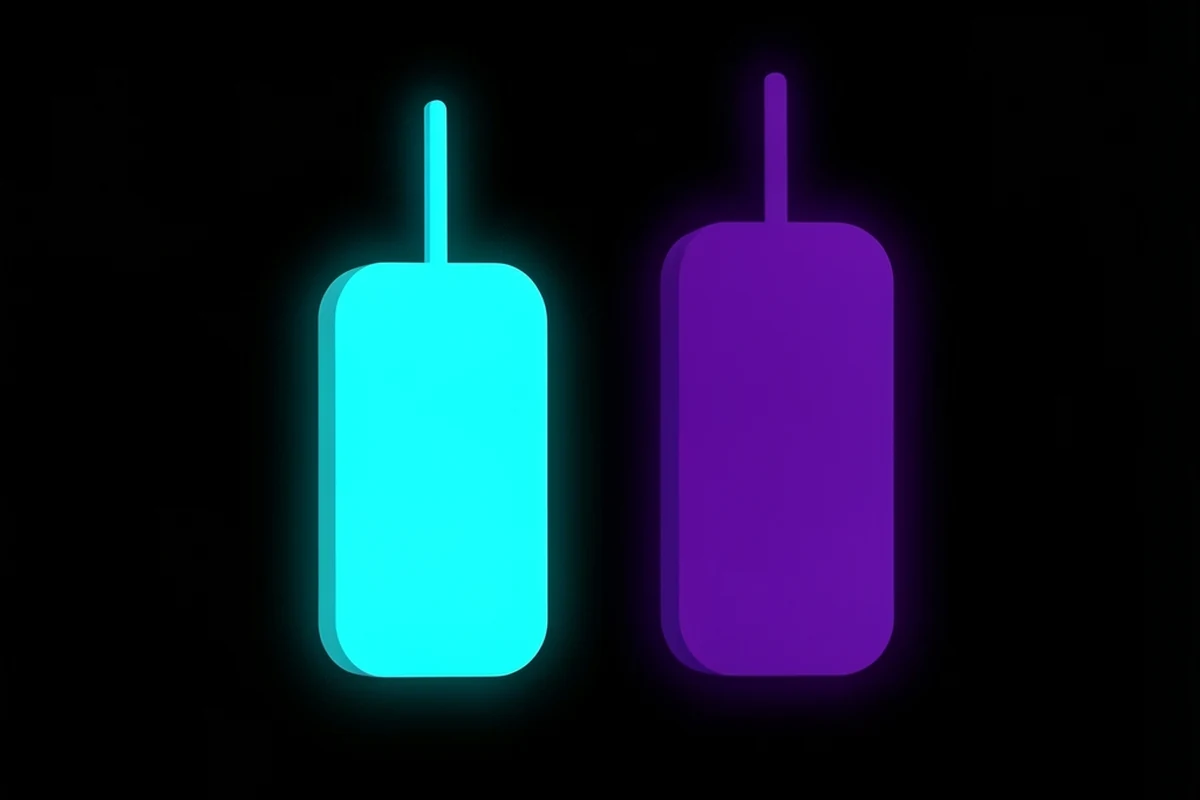
A doji is a candle where the open and close are nearly identical, leaving little or no body and wicks on both sides. It represents indecision — buyers and sellers fought to a near-draw during that period. A doji appearing after a strong trend is sometimes read as an early sign that momentum is stalling, though a doji in the middle of a strong trend often means nothing more than a pause.
A hammer has a small body near the top of its range with a long lower wick and little to no upper wick. It suggests sellers pushed price down during the period, but buyers stepped in and pushed it back up before the close — often read as a potential bullish signal when it appears after a downtrend. The inverse shape, a small body near the bottom with a long upper wick, is sometimes called a shooting star and is read the opposite way when it appears after an uptrend.
{{IMAGE:assets/images/candle-single-patterns.webp}}
Two- and three-candle patterns worth knowing
An engulfing pattern happens when one candle’s body completely covers the previous candle’s body. A bullish engulfing pattern — a green candle whose body swallows the prior red candle’s body — appearing after a downtrend is read as a potential reversal signal, since it suggests buyers overwhelmed the prior period’s selling pressure. A bearish engulfing pattern is the mirror image after an uptrend.
A morning star is a three-candle sequence: a large red candle, followed by a small-bodied candle (often a doji) that gaps down, followed by a large green candle that closes well into the first candle’s body. It’s read as a bullish reversal pattern after a downtrend. An evening star is the same idea inverted, read as bearish after an uptrend.
Why context matters more than the pattern alone
Every pattern above changes meaning depending on where it appears. A hammer in the middle of a sideways range carries far less weight than the same shape appearing right at a well-tested support level after a clear downtrend. Checking the surrounding trend, the nearest support and resistance zone, and volume on the pattern candle itself all matter more than memorizing pattern names — a textbook-perfect shape with no supporting context is weak evidence on its own.
{{IMAGE:assets/images/candle-context.webp}}
Quick reference: pattern, candle count, and conventional read
| Pattern | Candles | Conventionally read as |
|---|---|---|
| Doji | 1 | Indecision; possible momentum pause |
| Hammer | 1 | Potential bullish reversal after a downtrend |
| Shooting star | 1 | Potential bearish reversal after an uptrend |
| Bullish engulfing | 2 | Potential bullish reversal after a downtrend |
| Bearish engulfing | 2 | Potential bearish reversal after an uptrend |
| Morning star | 3 | Potential bullish reversal after a downtrend |
| Evening star | 3 | Potential bearish reversal after an uptrend |
How volume changes a pattern’s reliability
The same candlestick shape carries different weight depending on the volume behind it. A bullish engulfing candle on volume well above the recent average suggests real buying conviction stepped in; the identical shape on thin, below-average volume is easier to dismiss as noise. This is the same volume-confirmation principle covered on the homepage, applied specifically to patterns: a pattern with strong volume behind it is meaningfully stronger evidence than the same pattern without it, and checking volume takes only a glance at the bars already sitting under the chart.